Consulting · Implementation · Change
We don't bury potential.
We multiply it.
I'm Chezre. I take the admin that's eating your team's week and turn it into a system that runs itself — in Wrike, in Microsoft 365, or in software built for the job.
Usually the first thing a client notices isn't the dashboard. It's getting their evenings back.
Where the name comes from
X is ten. T is talents.
In the parable, one servant took what he was given, put it to work, and turned five talents into ten. Another buried his, afraid to risk it, and it never grew. XT Systems Delivery exists for businesses ready to do the first thing — put your people, processes and technology to work, and multiply the return.
How I add value
Three stages, in this order
Skipping straight to the software is why most implementations quietly die. These run in sequence for a reason.
Consulting
I diagnose where the complexity is actually costing you time, money and control — then design a roadmap for your business, not a generic one.
Implementation
Adding the right technology and making it work. Wrike, the Microsoft 365 stack, custom-built software, or AI woven into the daily grind.
Change management
Solidifying what's implemented. Technology only works if people use it — so I embed the new way of working until it survives past go-live.
How it runs
Review. Plan. Implement. Repeat.
Not a project with an end date — a rhythm. Most clients settle into a quarterly cycle.
Review
What actually happened last quarter — against the numbers, not the feelings.
Plan
We pick the few things worth doing next, and agree what "done" means for each.
Implement
I build it, your team uses it, and we find out what needs adjusting before the next review.
Client services
Every request in one place — and a number on how well you answered
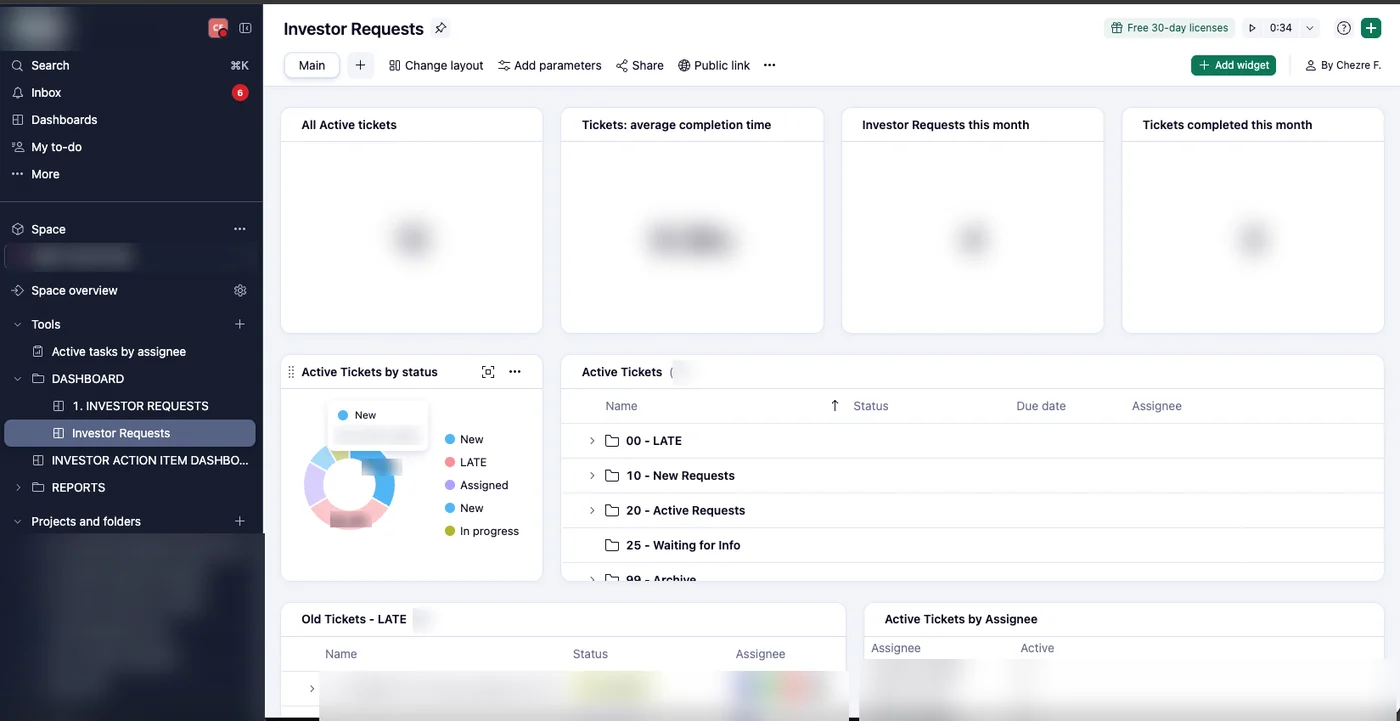
Client requests arrive by email, from a dozen people, at all hours. Left in inboxes, nobody can tell you how many are open, which ones are late, or how long you actually take. So the first thing I build is the thing that catches them.
How long you actually take
Average completion time across every closed request — measured, not estimated in a meeting. It's the number that tells you whether service is improving or just feeling busier.
What's late, before the client says so
Anything past its due date surfaces in its own view. The uncomfortable conversation happens internally, on your terms, instead of arriving as a complaint.
Who's carrying the load
Open requests per person, visible to everyone. Work gets levelled deliberately rather than discovered when somebody burns out or goes on leave.
The part most people skip
Something has to watch the machinery
A ticketing system that quietly stops pulling in email is worse than no system at all. Everything looks calm, the dashboard looks healthy, and the reason is that nothing is arriving.
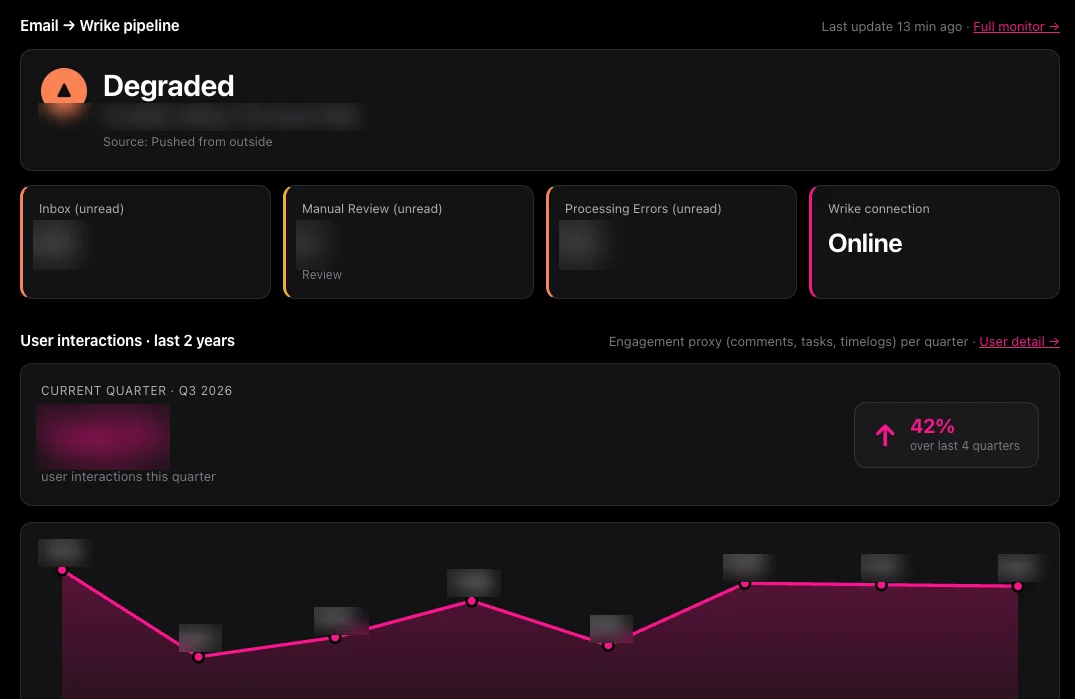
So alongside the service dashboard there's a second one with a single job: watch the pipeline itself. How many requests are waiting, how many failed to process, whether the connection is actually up. When something degrades it says so out loud, with a number next to it, before a client is the one who notices.
The bottom half of that screen is the part I care most about. Adoption is the whole job in change management, and engagement over time — comments, tasks, hours logged — is the only honest way to tell whether a new system took or quietly got abandoned after go-live. It's the number I'd want you to judge me on.
What the monitor answers
Is anything stuck?
Requests sitting in review instead of moving through.
Did anything fail silently?
Processing errors counted, not buried in a log nobody opens.
Is the connection alive?
A straight yes or no, checked continuously.
Is the team still using it?
Engagement per quarter, tracked for years — not just the week after training.
What that felt like from the inside
"The speed of execution and the knowledge of the IT systems and processes was very helpful in us not having to reinvent the wheel in areas where we are not experts. This has significantly increased our understanding of how we can leverage systems to improve our productivity and accountability in the business."
What I build with
Tools you can still run after I leave
Nothing exotic. The point is a system your team can maintain without calling me every week.
Microsoft 365 as the operating hub
Organise the work where your team already lives — channels, files, meetings and lightweight automation.
Wrike for structured delivery
Request forms, dashboards, workflows and reporting — so delivery becomes visible, measurable and repeatable.